The architecture 2030 Challenge calls for all new US buildings, developments, and major renovations to be carbon-neutral by 2030. The key to meeting this challenge? Energy analysis from start to finish. Analyzing a complete or near-final design has little or no effect on a building’s operational energy performance. But leveraging energy analysis as a decision-making tool throughout the design lifecycle—from conceptual massing, right on through to complex BIM modeling— can have a tremendous effect. This approach helps architects capture performance improvement opportunities throughout the course of design development, potentially saving building owners a fortune in operational energy costs and significantly reducing operational carbon emissions. Revit empowers architects to do just that using Insight, the cloud-based energy analysis software which is a service available to subscribers to Revit and the Autodesk AEC Collection.
The only in-BIM energy analysis tool
With Insight, Revit users can analyze BIM models at the click of a button, in the cloud. The tool is fast and easy to use, and works for conceptual and complex models alike, providing guidance throughout the design lifecycle. Because it pulls the data it needs straight from the Revit model, there’s no need to export a dedicated “throw-away” energy model. Users get the guidance needed to understand the energy implications of design changes right inside the BIM workflow.
To access Insight (aka “Energy Optimization for Revit”), follow these easy steps:
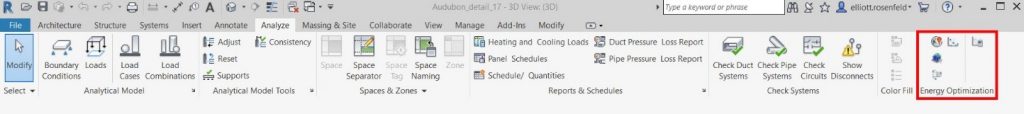
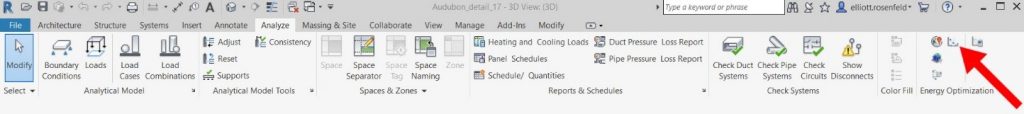
- Go to Revit’s Analyze tab / Energy Optimization panel.
- Specify the building location.
- Create the energy model. This step automatically generates an energy model from the Revit architectural model.
- Generate the energy analysis. This step sends the energy model to the cloud for simulation and analysis.
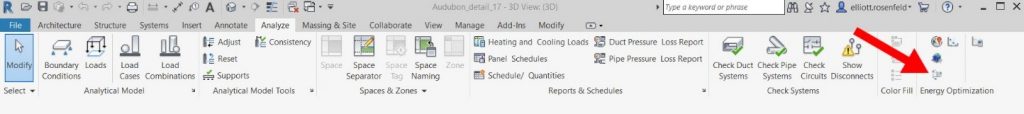
5. You will receive an email to confirm receipt of the analysis request, and another email containing a link to the model in Autodesk Insight when the analysis is complete. Launch Insight via the emailed link, or click the Optimize icon in the Energy Optimization panel.
The Insight Dashboard
Repeat this process often throughout the project, continuously driving towards better energy performance. Get detailed guidance on this workflow.
High performance building design made easy
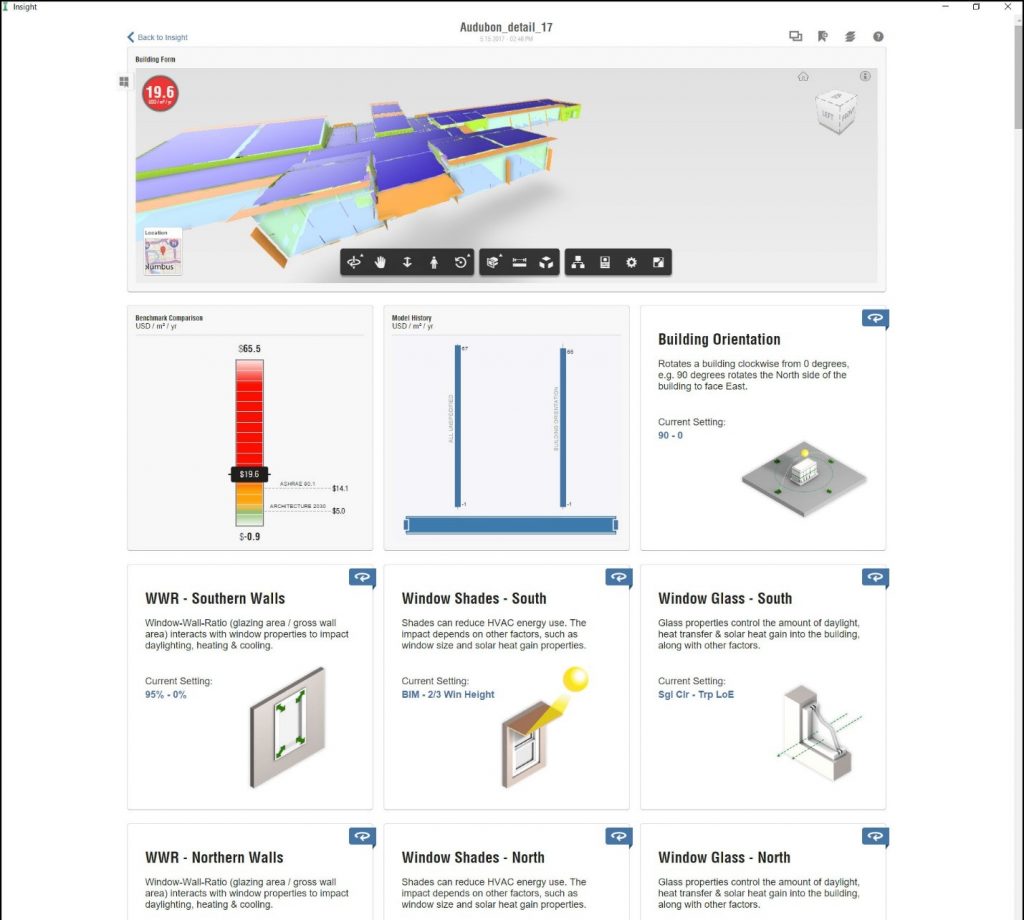
Insight empowers design teams to identify key areas of opportunity for each specific site and building design, making sensitivity analysis a breeze. Whether it’s window-to-wall ratio, roof construction, or HVAC efficiency, the factors most strongly shaping a building’s energy performance show up at a glance in Insight’s dashboard. Clicking to flip cards on the Insight dashboard reveals a curve for each factor affecting energy performance. The steeper the curve’s slope, the more sensitive the building will be to changes to that factor. For example, in the below scenario, it is revealed that Lighting Efficiency, HVAC Type, and Infiltration represent better areas of opportunity than Wall or Roof Construction.

The Insight dashboard, factor cards flipped to reveal values and ranges set.
See how the model is performing, and explore alternate scenarios, trying different settings for a wide range of factors affecting building performance. Insight’s Energy Cost Mean indicator updates automatically as you adjust each factor to target different values and ranges. Insight saves scenarios, allowing the comparison of multiple options for the best possible solution.
Insight also provides analysis and visualizations for heating and cooling loads per spatial volume (powered by the EnergyPlus simulation engine), and solar photovoltaic potential per rooftop surface.
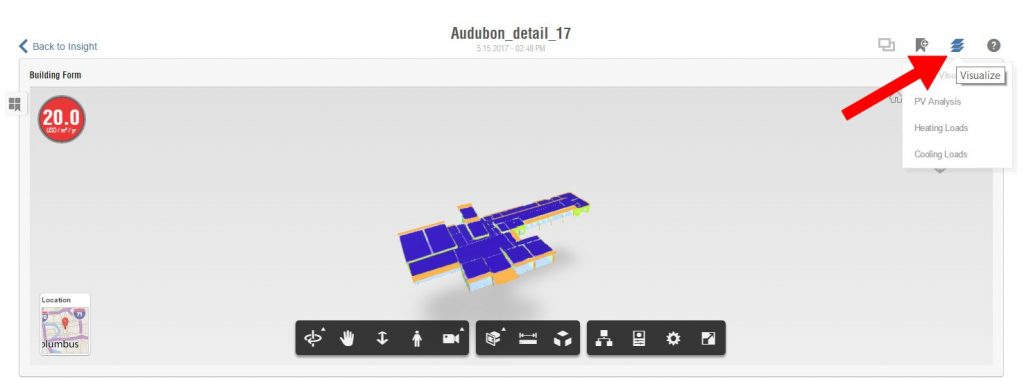
Accessing Heating and Cooling Loads and Solar PV Analysis visualizations in Insight
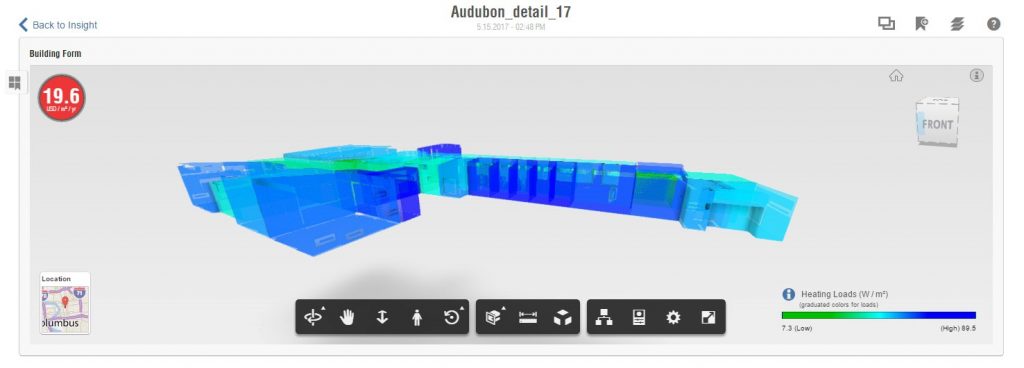
Heating Loads visualization
Additional Capabilities with the Insight Plug-in
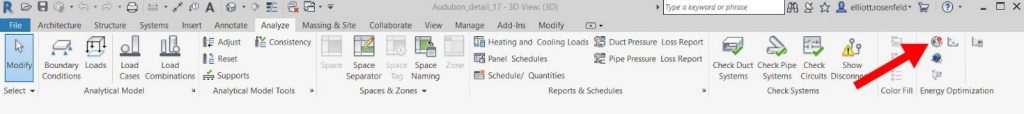
You can access additional energy analysis capabilities by installing the Insight plug-in for Revit, available here. Once installed, you will see three additional icons to the right of the Energy Optimization panel in the Analysis tab.

These icons provide access to the following additional analysis capabilities:
- The Heating and Cooling Loads icon generates tabular reports from Revit, harnessing the power of EnergyPlus to deliver dynamic thermal heating and cooling loads.
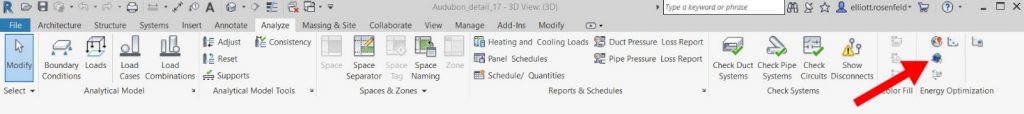
- The Lighting Analysis icon provides access to in-context daylighting and lighting analysis results, and automated scheduling to help document light levels through your design.
- The Solar Analysis icon provides access to in-context solar radiation analysis results to help you track solar energy potential throughout your design.
AIA 2030 reporting built right in
For signatories of the AIA 2030 Commitment, the AIA’s framework to track progress towards the architecture 2030 Challenge, Insight makes reporting easier than ever with an automated submission feature that eliminates the need to manually enter building data on the Design Data Exchange (DDx). Simply select the design scenario to report, and Insight automates reporting to the DDx. Once submitted, the pertinent details auto-populate in the DDx project summary, making it easier than ever to track progress towards 2030 goals.
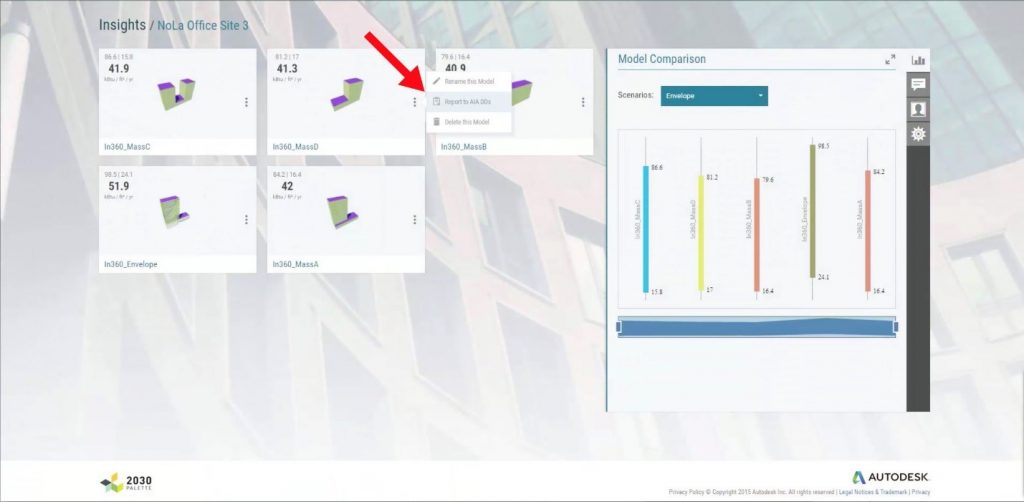
Selecting a saved scenario to report the AIA DDx
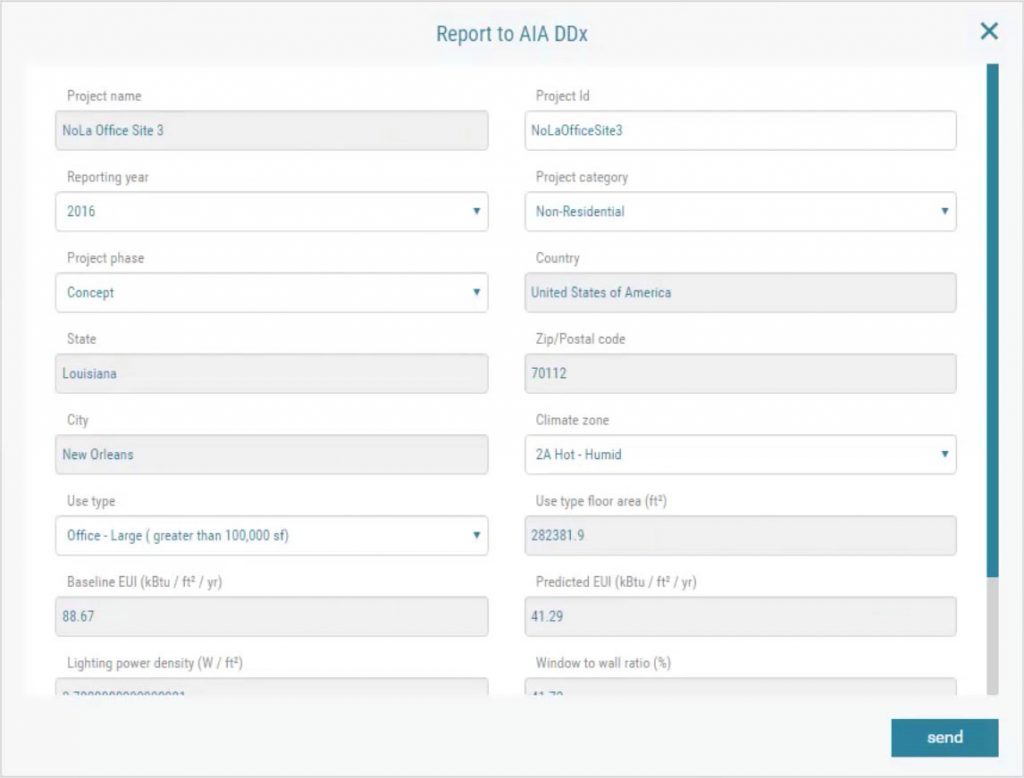
Reporting a saved scenario to report the AIA DDx
The year 2030 is just around the corner and buildings still account for approximately 30% of global greenhouse gas emissions. As we transition to a low-carbon future, forward-thinking architecture firms are leading the charge. With Revit’s energy analysis capabilities, Autodesk is behind them all the way.
Get the skills needed to create buildings that meet the energy efficiency targets of the architecture 2030 Challenge
Get started with Insight tools for Revit


