We investigate whether Pi (π) can actually be used to help compute details related to a river’s path. Is there something special about Pi that can make modeling rivers, bridges, culverts, spillways, levees, floodplain and floodway delineations, stream diversions, channel improvements, and split flows easier?
The constant Pi has been associated with everything from crop circles to the construction of the Egyptian Pyramids. While it might seem like a neat idea that the mysteries of nature can be explained by a mathematical algorithm – like measuring the concentric circles formed by ripples across a pond when something hits the surface of the water – when it comes to calculating a river’s path using Pi, it’s not so straightforward.
A river’s course is influenced by the complex interactions of various factors. Human intervention through infrastructure projects, seasonal weather and extreme natural events such as flooding can all have an effect. Meteorologists can use satellite data, radar and supercomputers to forecast and measure the weather’s impact on the environment. So, how should we approach the calculation of a river’s path?
Is there a calculation for a river’s path from point A to point B?
Calculating a river’s path typically involves factors such as topography, terrain, elevation, and hydrological principles combined with the analysis of geographical and geological data.
Rivers flow based on physical forces like gravity, elevation differences, and the shape of the landscape. Geographic Information Systems (GIS) and hydrological models made with apps like Autodesk’s own InfoWorks ICM are often used to simulate and predict the course of rivers based on these kinds of factors. Does the app do it by embedding a Pi-based formula?
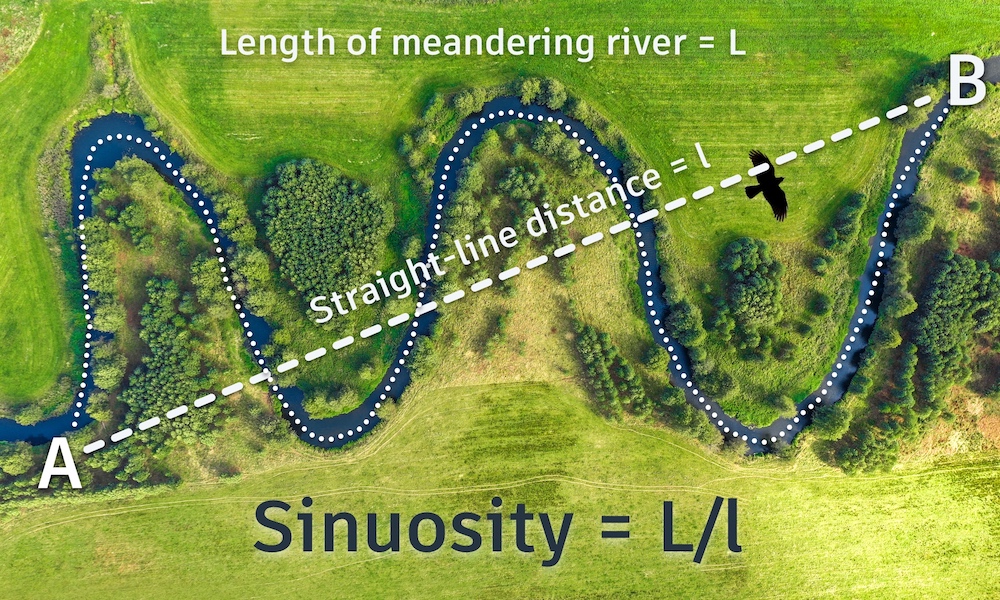
It is possible to measure the bends and turns of a river with a simple formula which divides the length of a river’s course by the straight-line, direct distance between its start and end points (as the crow flies). The resulting measurement is referred to as ‘sinuosity’ – a totally straight river would have a sinuosity of 1, for example, while a very bendy river will have a higher sinuosity.
What is sinuosity?
Referencing the ability to curve or bend easily and flexibly, and often used to describe streams and rivers in geography and geomorphology, sinuosity provides a useful metric for calculating how much the path of a river deviates from a straight line over a certain distance.
In other words, it quantifies the degree of meandering or winding across a river’s course. The sinuosity of a river can be calculated by measuring a river’s actual meandering channel length and dividing it by the straightest route, as the crow flies, from its source to its mouth.
A river is said to be “meandering” if the sinuosity index is above 1.5.
The resulting sinuosity value can vary widely based on the characteristics of a river and the landscape it flows through. A sinuosity value of greater than 1 indicates a meandering river. For example, a sinuosity value of 1.5 would mean that the river’s actual course is 1.5 times longer than the straight line distance between its start and end points.
According to mathematician James Grime, who wrote about this topic in The Guardian, “a very bendy river can have very high sinuosity with no limit to how high it can go.”
Sinuosity is an important parameter to understand how a river interacts with its surrounding environment. It’s influenced by factors such as the geological composition of the land, the gradient of the terrain, the river’s discharge, and the sediment transport within the river.
High sinuosity rivers tend to have more pronounced meanders and may change their course more frequently over time, while low sinuosity rivers are relatively straight and stable.
Pi me a river
It has been claimed that the average sinuosity of rivers around the world is Pi… If true, this would mean that rivers are typically just over three times longer than the straightest route from source to mouth with an average sinuosity value equating to Pi (~3.14).
This theory was explored in a 1996 paper published in the journal Science. Entitled River Meandering as a Self Organization Process, Hans-Henrik Stølum used simulations and empirical data to show a meandering process that “self-organizes the river morphology into a critical state”.
Stølum justified his research with fractal geometry – the theory that if the bends of a river can be compared with arcs of circles, and the little curves of a river by arcs of smaller circles, then the sinuosity of the river can be calculated to be Pi. His study found that sinuosity varied between a low of 2.7 and a high of 3.5. His work didn’t identify a golden ratio for rivers, but it is an intriguing theory.
Is Pi the average sinuosity of all rivers in the world combined? Numberphile attempts to do the math.
One point not in his favor: A more recent crowdsourced data project failed to replicate Stølum’s Pi average and was ultimately too small to prove or disprove a theoretical model for Pi calculating the total average of all the world’s rivers. After analyzing 258 rivers, it recorded an average sinuosity of 1.94.
One of Einstein’s other theories
While the mathematical constant Pi has applications in geometry and physics, it isn’t directly used to determine a river’s path. The mathematics involved are more related to fluid dynamics and the laws of physics than to the use of a constant like Pi.
Like ancient mathematicians before him who found the concept of irrationality maddening, Albert Einstein refused to believe in the inherent unpredictability of the world and was among the first to ponder Pi’s capabilities with regards to calculating river flows. He used fluid dynamics and chaos theory to show that rivers tend to bend into loops.
Einstein explained how helical flow develops in a meandering river, and that because the higher-velocity portions of the stream will be driven to the outside (concave) portion of the river bend, erosion will be greater there. He noted that because the helical flow possesses inertia, the circulation (and the erosion) will be at their maximum beyond the inflection of the curve.
Hence, the waveform of the river will migrate in a down-current direction. Finally, Einstein explained that the larger the cross-sectional area of a river, the slower the helical flow will be absorbed by friction; which explains why larger rivers have meander patterns with longer wavelengths.
Albert Einstein’s influence runs deep and wide. He was one of the first to identify important details about the Coriolis Effect.
As Grime notes, erosion causes bends in rivers to become more extreme, which increases a river’s sinuosity. Nature then takes its course as a river aims to correct itself with the water taking a shortcut and cutting off the bend to form an oxbow lake, lowering a river’s sinuosity. It was during his study of this oscillation that Stølum first noticed the value of Pi.
The length along the river of the meander is like the circumference of a circle, while the straight-line distance from one bend to the next is diameter-like. Hence, it makes sense that the ratio of these lengths would appear Pi-like. But the truth is a bit less straightforward.
Ultimately, while there is evidence of natural mathematical phenomena at play in how rivers evolve, their course is influenced by many competing factors that one algorithm alone can’t explain.
Subscribe to the One Water blog newsletter and fill up on innovative and interesting water trends – in particular things that are related to sustainability.
Sign up for the One Water Blog newsletter, and we'll keep you updated about our top stories, along with the best content we find online. We only send out a newsletter when we have something interesting to share.
Your privacy is important to us and so is an optimal experience. To help us customize information and build applications, we collect data about your use of this site.
Learn more about the Third-Party Services we use in each category, and how we use the data we collect from you online.
Strictly necessary – required for our site to work and to provide services to you
Qualtrics
W
Akamai mPulse
W
Digital River
W
Dynatrace
W
Khoros
W
Launch Darkly
W
New Relic
W
Salesforce Live Agent
W
Wistia
W
Tealium
W
Upsellit
W
CJ Affiliates
W
Commission Factory
W
Google Analytics (Strictly Necessary)
W
Typepad Stats
W
Geo Targetly
W
SpeedCurve
W
Qualified
#
Improve your experience – allows us to show you what is relevant to you
Google Optimize
W
ClickTale
W
OneSignal
W
Optimizely
W
Amplitude
W
Snowplow
W
UserVoice
W
Clearbit
#
YouTube
#
Customize your advertising – permits us to offer targeted advertising to you
Adobe Analytics
W
Google Analytics (Web Analytics)
W
AdWords
W
Marketo
W
Doubleclick
W
HubSpot
W
Twitter
W
Facebook
W
LinkedIn
W
Yahoo! Japan
W
Naver
W
Quantcast
W
Call Tracking
W
Wunderkind
W
ADC Media
W
AgrantSEM
W
Bidtellect
W
Bing
W
G2Crowd
W
NMPI Display
W
VK
W
Adobe Target
W
Google Analytics (Advertising)
W
Trendkite
W
Hotjar
W
6 Sense
W
Terminus
W
StackAdapt
W
The Trade Desk
W
RollWorks
W
Are you sure you want a less customized experience?
We can access your data only if you select "yes" for the categories on the previous screen. This lets us tailor our marketing so that it's more relevant for you. You can change your settings at any time by visiting our privacy statement
Your experience. Your choice.
We care about your privacy. The data we collect helps us understand how you use our products, what information you might be interested in, and what we can improve to make your engagement with Autodesk more rewarding.
May we collect and use your data to tailor your experience?
Explore the benefits of a customized experience by managing your privacy settings for this site or visit our Privacy Statement to learn more about your options.