It doesn’t matter if you’re looking to determine the drag on a car, the air speed velocity of an Unladen Swallow or helping a duck evade an ever annoying hound, Autodesk Flow Design is the tool to quickly get things done. Below is a more detailed breakdown of steps to be successful with Flow Design, no matter what model you’re using.
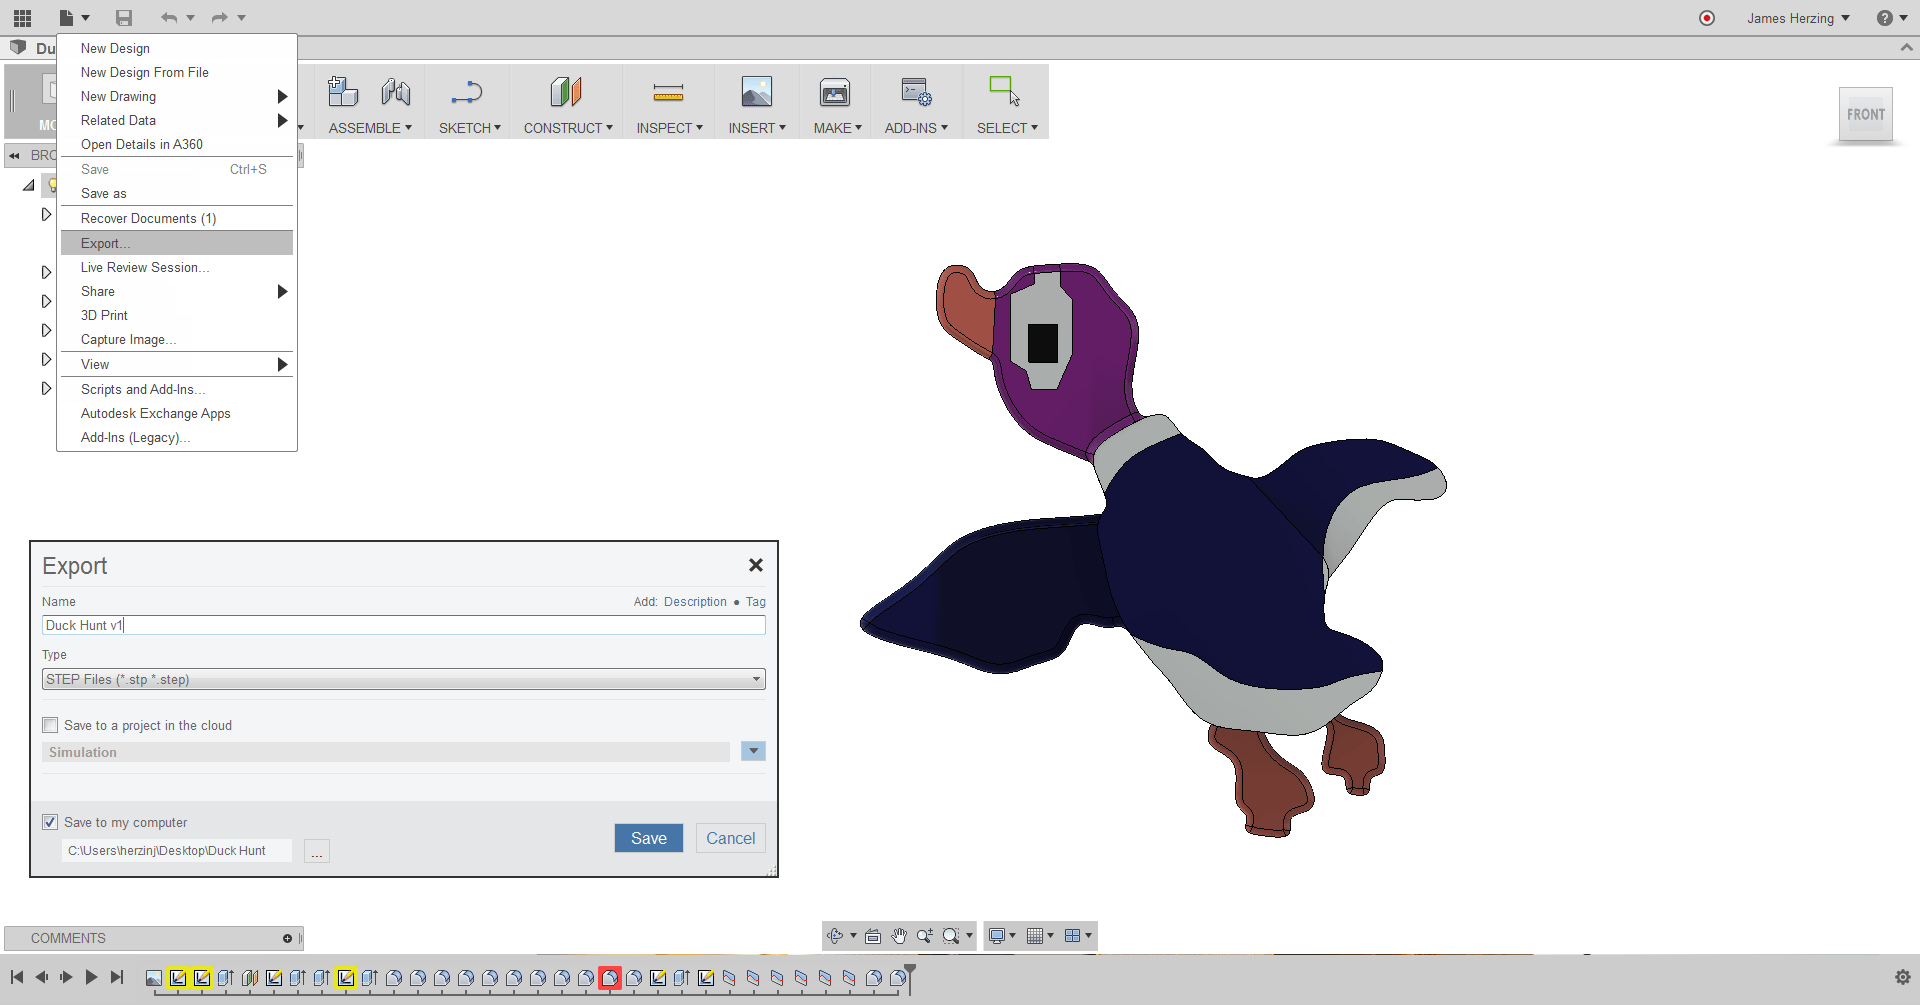
To begin, I chose to design the duck (purple and blue version, not green and black) in Fusion 360. Do yourself a favor, if you haven’t given this a try already, stop reading this post and go download it. It’s free to try, and very likely free for you all together, so what do you have to lose? OK, back to the simulation content. From Fusion 360, you’ll just have to click on the file drop down and choose to Export the model. I chose to use a .stp file, but .igs or .sat would work just as well.
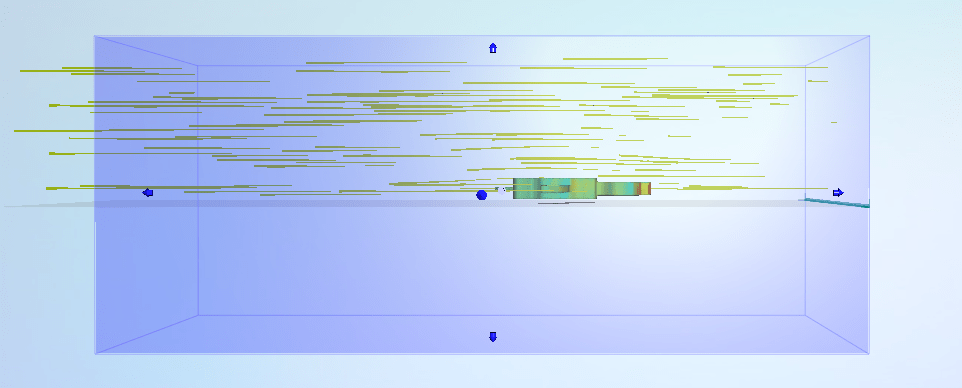
Now launch Autodesk Flow Design and choose to Import your file (Want to download my duck? Go grab it from the Fusion 360 gallery). Once opened, the flow around your duck and pressure on it will immediately start calculating. Since this is a simple model you will start to see results very quickly. For larger geometry it can sometimes take a few minutes to start seeing the flow.

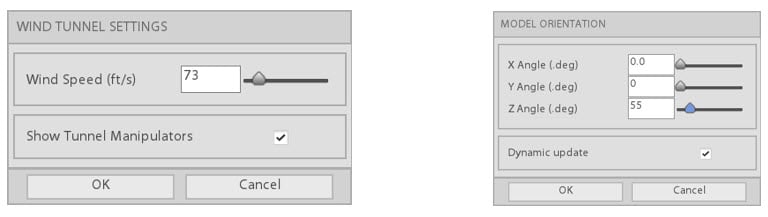
So these results might give you a feel for general patterns, but to get something more accurate you’ll have to input the wind speed that you’re interested in. Clicking the wind tunnel button (marked 1) will let you define your wind speed. For our duck in full flight, I’ve used a value of 73 ft/s. After pressing OK the results are automatically recalculated. If you’re interested in seeing the drag on the duck at this point click on the drag plot button (marked 2). You should see a value around 0.6 – 0.7.
For any of you who’ve played Duck Hunt, you know these mallards are smarter than your typical duck. For that reason, we need to optimize the drag on them as they fly. Choosing the orientation button (marked 3 above) and rotating the Z Angle to 55 gets this duck pointed beak first.
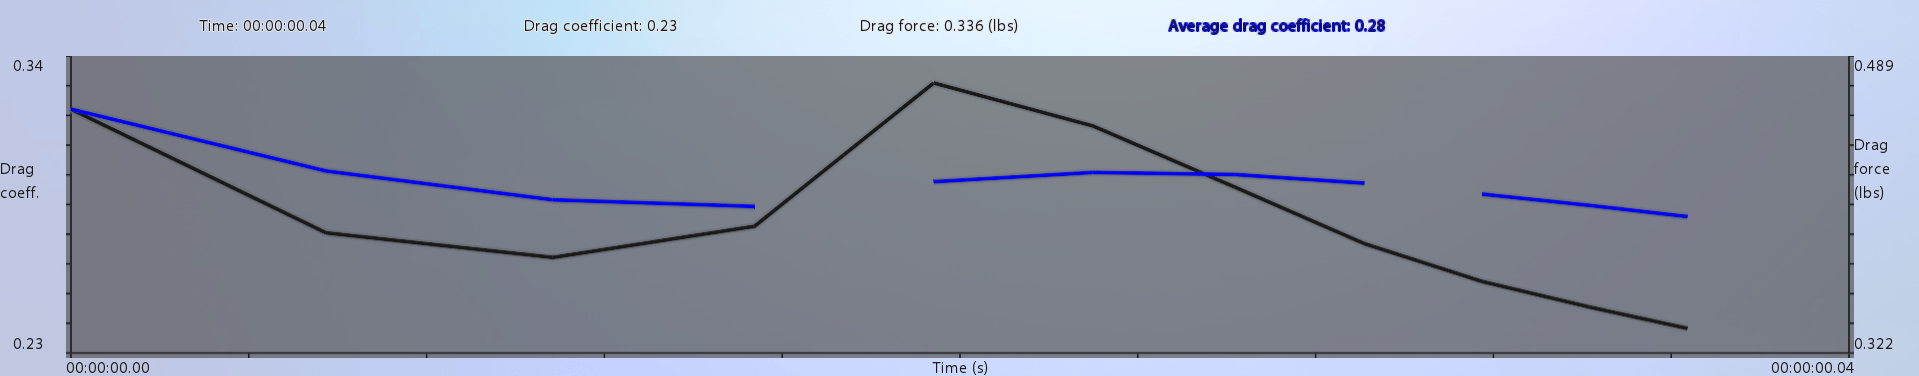
Clicking the drag plot button again will show us that the duck now has an average drag coefficient of about 0.3, half of what it was before! That laughing dog will have nothing to chuckle about now.
I did want to go into one extra feature that wasn’t discussed in the video, and that is changing the size of the fluid domain. For our analysis, we were basically looking at a half symmetry model with flow only going around half the duck. To change this so that it goes around the entire duck, or to increase and decrease the fluid in front of and behind the duck, click on the wind tunnel settings button again. With the Show Tunnel Manipulators check box active you will see blue handles that you can pull to change the size of the fluid domain. This can be important to ensure you have enough fluid around your design to analyze fully developed flow.
That’s all there is too it! You’re now ready to take things to the next level and use an actual model in Flow Design to determine flow patterns, velocity and drag. Need to see things one more time to make sure this tools for you? Here’s another look at the video.
d