Introduction
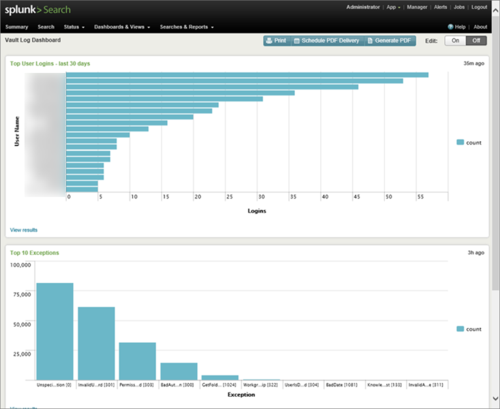
This document contains some steps to configure Splunk® to report and gather data from your Vault environment and make it available through a web interface for your desktop, tablet or mobile device. Splunk offers monitoring and alert capabilities in real-time based on thresholds conditions around the clock. Build charts and dashboards to show important trends, top values and frequency of reoccurring events.

Vault Log Files
Vault log files can be monitored and indexed for reporting on a dashboard. This section explains how to configure Splunk to index the files and extract data to build dashboards and reports.
Log File Setup
To configure Splunk to index the log files, perform the following steps:
- Select Settings > Data Input on the menu.
- Click Files & Directories.
- Click the New button to add an input.
- In the Preview Data page, navigate to the location of the Vault log files. If you have installed Splunk on the same server as the Vault server, you can use “C:programdataautodeskvaultserverfilestore” for the location. If you have installed Splunk on a different server than the Vault server, you have to share the location of the Vault log files and use a UNC path at this step.
- Click Next
- Click the New button for the Source Type.
- In the Source Type field enter
- Select Custom as the Source Type Category.
- Enter a description if you want in the description field.
- Click Review then click Submit.
Field Extractions
When monitor Vault log files, information can be extracted for charting and reporting. Create extraction fields for the logs to get this information.
- Select Settings > Fields on the menu.
- Click Add New next to Field Extractions
- Click the New
- Select Search in the Destination app drop-down
- Use the chart below to create the field extractions.
- Click Save when you are done.
| Name | Source Type | Type | Extraction/Transform |
| Exception | Vault_Logs | Inline | (?i).*?: (?P<Exception>w+s+[d+]) |
| Host | Vault_Logs | Inline | (?i) host((?P<Host>[^)]+) |
| LicenseID | Vault_Logs | Inline | (?i) .*?((?P<LicenseID>d+)(?=)) |
| Log_Type | Vault_Logs | Inline | (?i)^(?:[^ ]* ){3}(?P<Log_Type>[^ ]+) |
| Username | Vault_Logs | Inline | (?i) username((?P<Username>[^)]+) |
Creating a Search Once your extractions have been creating, you are ready to create reports and a dashboard.
- Select Search & Reporting from the App pull-down menu in the top left corner of the page.
- In the Search field, you can use the example search screens below.
- Also, you can create custom searches by clicking Data Summary
- Click the Sourcetypes tab and select the Vault_Logs type.
- A list appears with data from the logs.
- Click the All Fields
- Place a check next to the names of all of the field extractions you created.
- Click the X in the upper right corner to close the dialog.
- Your custom fields appear on the left of the data. Click one of the fields to see the results.
- Once you like your search, you can click the Visualization tab to see and change a chart format.
- Click Save As in the upper right corner of the search and save it as a report.
- Give it a name and save it.
- Click Add to Dashboard
- Create a new dashboard or use an existing one and add the chart to it.
Report for Hosts Connections sourcetype= “Vault_Logs” | top limit=20 Host
Report User Logins
sourcetype=”Vault_Logs” Username=”*” Log_Type=Acquired Username!=JobUser | top limit=20 Username
Note: “JobUser” is the account that the Job Processor(s) are running under.
Reported Exceptions in vlogs
sourcetype=”Vault_Logs”| top limit=20 Exception
Summary
Splunk is a very powerful tool which you can add lots of data to monitor your Vault environment. You can include Event Viewer, IIS, SQL data and anything else you can think of. Now go for it!
