Every week I meet up with my customers to understand how they use CFD to see if I can help add value to their simulation process. I have noticed it is not uncommon for me to hear that they do not use the Decision Center, and are also unaware of what it is, and the value it can provide.
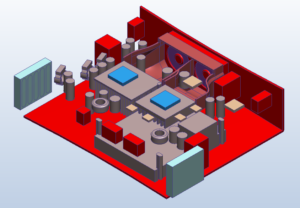
[Figure 1] Electronics Layout: inlets (light blue), fan baffle (magenta), chips (blue).
Autodesk CFD was originally designed in 1992 with the sole purpose of providing analytical capabilities to the everyday engineer to assist in guiding design decisions. In order to provide insight into multiple design strengths and weaknesses as they relate to CFD, the Decision Center was born. We can use the Decision Center to identify trends amongst multiple designs to help us decide which design yields the best performance under operating conditions. Using this specific capability of CFD should be integral in your design process if you are looking to identify differences between different design concepts so that you can build optimal products.
Imagine you are early in your design process and you and your teammates are brainstorming different housing concepts to reduce the negative effects of temperature on the electronics. How do you know which design is the best design? This is where the power of the decision center lies, adding value to driving design innovation. Let’s look at how we can utilize this power with respect to Figure 1. Although there is an infinite number of design options available for this electronic device design, we’ll focus on the following four viable design options.
Design 1: No fan baffle; change inlet location closer to fan
Design 2: No fan baffle; move inlet locations away from the fan
Design 3: Add fan baffle
Design 4: Add fan baffle; change heat sink profile
With these designs in mind, let’s first talk about the workflow within CFD to simulate these.
Use Cloning for Duplicating Designs
The first thing we should do is set up a baseline analysis with CFD. We will want to assign all of the materials, inputs, solving parameters, and initial conditions (if necessary).
Once we have this model setup to run, we can clone the inputs from this model to duplicate studies. The big value add here is not having to duplicate efforts by defining a new model. All of the properties assigned to the original model will be transferred to the cloned model, saving us a ton of time. The only caveat here is changing geometry. For the part(s) we change geometrically, we may have to redefine inputs to those specific components.
Here’s how to do it:
Design Study Tree > Right Click Design Name > Clone
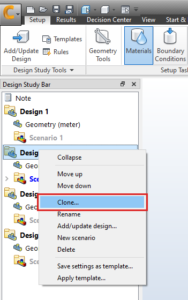
[Figure 2] Design Tree layout for cloning studies.
Once the design has been cloned, it’s time to set up models to solve. If we’re leveraging Autodesk CFD cloud solving, we can solve as many designs as we wish, in parallel. This means we can free up our computer’s resources and continue about our day to day activities. Alternatively, we can solve locally, which will not run the simulations in parallel, but sequentially.
Capture the Critical Data You Want to Compare
Now that we have some designs solved, it’s time to generate the data we want to analyze so we can begin to identify which design is the most optimal. In order to do this, we should generate plots and values that are going to help us reach our simulation goals. In this case, we want to minimize the effects of high temperatures on electronics by ensuring an even airflow distribution. We may want to create a plot that displays airflow velocity and temperature, as well as temperatures on the GPU and CPU.
Generate a plot and summarize the results:
For each plot that we want to compare, select ‘Summary image” from the icon located on the far left of the image. This image will be carried onto the additional run Design Studies automatically, so we can compare the differences in the Decision Center.
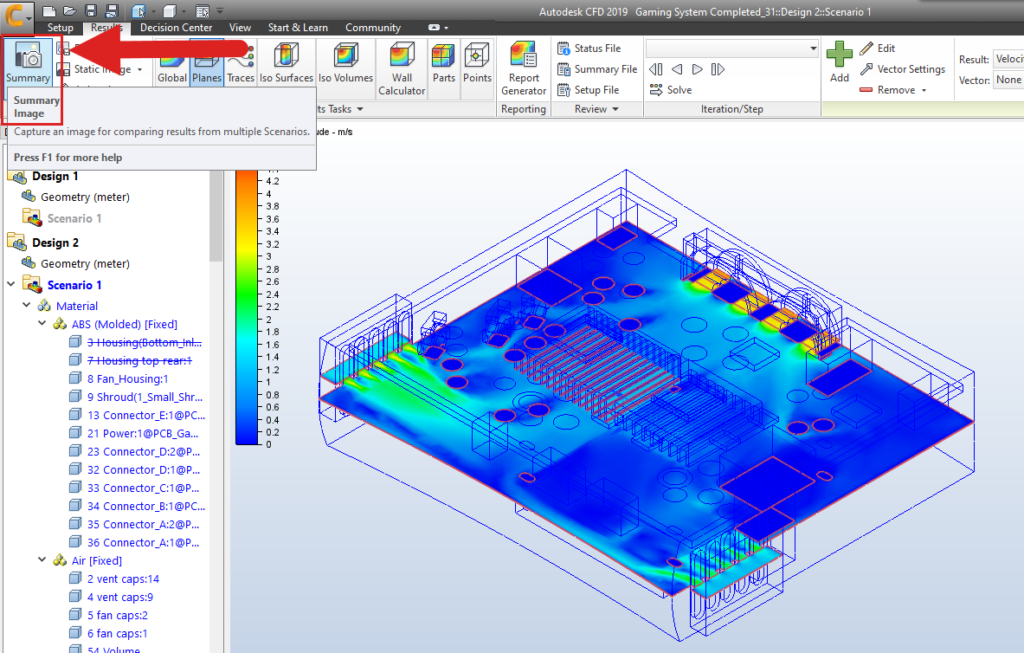
[Figure 3] Locating the “Summary Image” option to generate plots for the Decision Center.
In order to get the average temperature of a volume, select ‘Parts’ from the ribbon. Once you’ve selected the volume select ‘Make Summary’. This will give you the average bulk values of the volume and place them in the Decision Center.
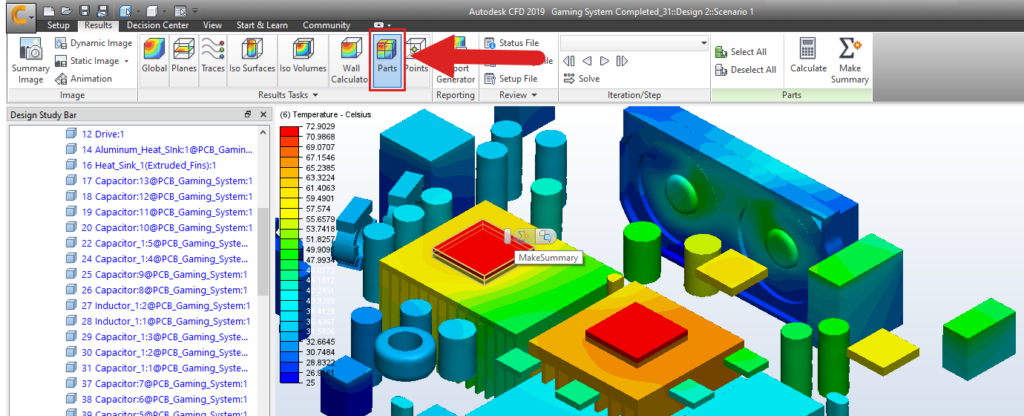
[Figure 4] Locating the Bulk Average summary of parts.
Compare the Data
Now that a few result criteria have been established, it’s time to compare the designs. It’s important to note that if you are still early in the design cycle, we should focus more on trends, rather than spending time getting hard numbers.
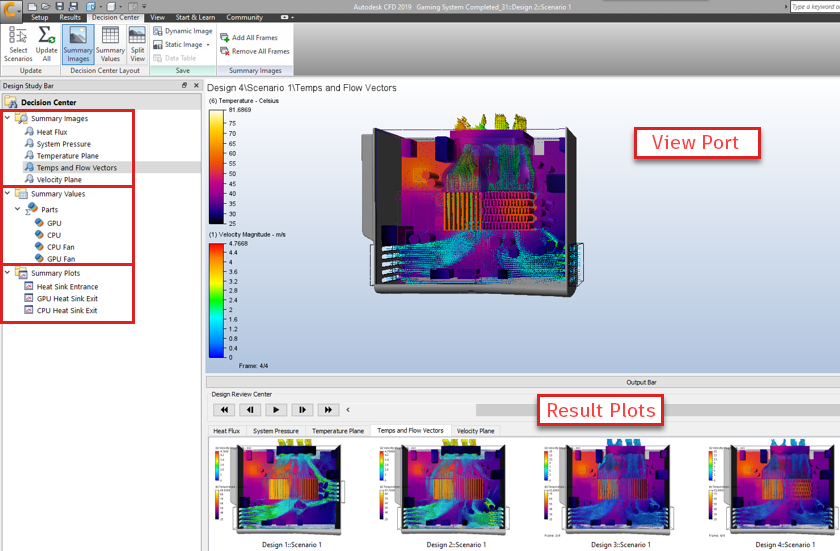
[Figure 5] Image of the Design Center layout.
- Design Study Bar
- Summary Images: Location of comparable results images (i.e., results plots)
- Summary Values: Comparable numerical data
- Summary Plots: Comparable XY plots
- View Port
- Location of model comparisons
- Results Plots
- Saved results plots for each design study for comparison
Scrolling to the ‘View’ section, we can change the number of viewports for comparison. In order to compare the data, select the desired plot to view from the Design Study Bar, and drag/drop the various results plots into the Viewport.
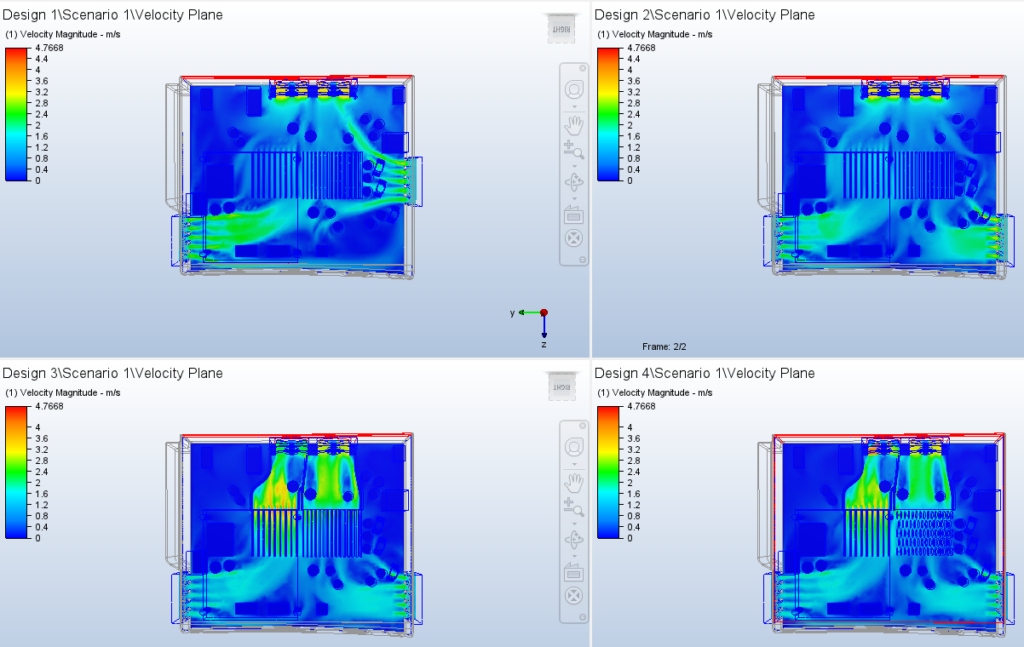
[Figure 6] Decision Center viewports.
We can see from the above plot, that the baffles have had a positive impact on the airflow. Both designs containing the baffles show they are able to direct the air over top of the GPU and CPU, thus keeping them cool. Therefore, we can quickly rule out Design 1 and 2, and focus our attention on Designs 3 and 4, located in the bottom of Figure 6.
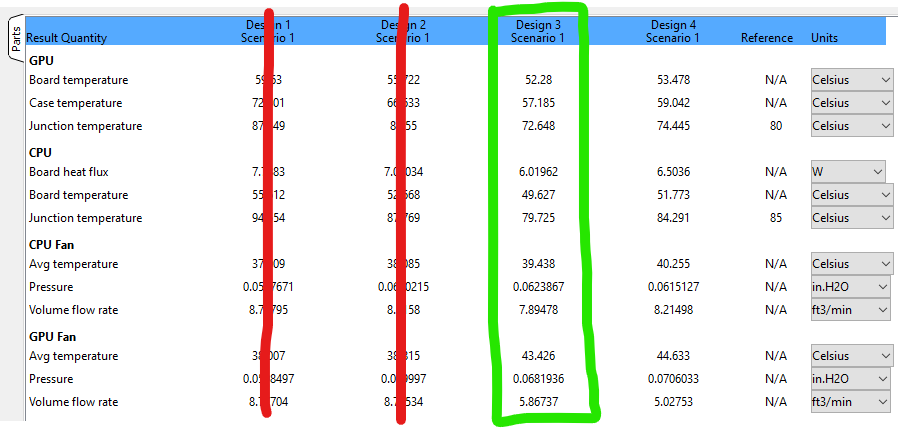
[Figure 7] Summary values in the Decision Center.
Scanning the Summary Values, we can see that Design 3 yields the lowest temperature of the designs. The only difference between Design 3 and 4 is a different type of heat sink. Design 3 has lower board and junction temperatures than that of Design 4, therefore we were able to successfully select the best performing design out of the designs we tested. We can also take additional variables into consideration such as cost to decide if the boost in performance is worth the trade of cost.
If you are not using this tool, I highly recommend you start using it as a part of your engineering process. The best aspect of Autodesk CFD is its ease of use and the impact it can have driving design direction without the need to physically test multiple prototypes. The decision center is the backbone of design when using a CFD solution and can help you design better products versus the competition all while understanding the performance and cost impacts.

(0)